8. Conclusion
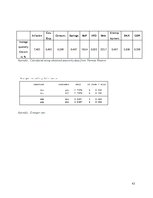
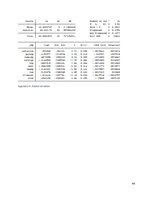
After creating the Stata analysis, the authors arrived to several conclusions. To begin with, there is no doubt that the stock market and GDP move together by a certain amount and an approximate amount is 0.013% of an additional increase in GDP with an additional increase by 1% in DAX. However, this result cannot be interpreted lightly due to the presence of reverse causality, since stock markets are closely linked to the economy, as proven by the Granger test in Appendix 6. Separate assumptions were made as to why some macroeconomic variables did not pass at a 10% significance level. There are spikes in these variables that the economic system takes time to adjust, or perhaps they do not do so at all, because of off-setting situations, for example. Some variables do not change that much over time, which opens the door for the question – whether or not that particular variable that slowly changes really has any long term effect on GDP?
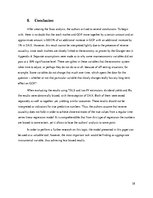
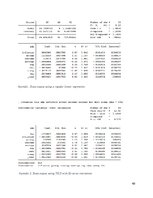
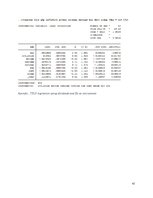
When evaluating the results using TSLS and two IV estimators, dividend yields and Ifo, the results were abnormally biased, with the exception of DAX. Both of them were tested separately as well as together, yet, yielding similar outcomes. These results should not be interpreted as indicators for true predictive numbers. Thus, the authors assume that reverse causality does not hold in order to achieve close estimates of the true values from a regular time series linear regression model. It is comprehendible that from this type of regression the numbers are biased to some extent, yet it allows to base the authors’ analysis to some point.
In order to perform a further research on this topic, the model presented in this paper can be used as a valuable tool, however, the most important task would be finding an appropriate instrumental variable, thus achieving less biased results.
…